Another XLWT Example
After completing the last example, I wanted to try something a little more interesting with XLWT this time around. This article describes a short script that uses Python and XLWT to download some raw data from the web, parse it, and write a spreadsheet with a new column derived from the data.
The data for this example comes from research done by David Harrison and Daniel L. Rubinfeld in “Hedonic Housing Prices and the Demand for Clean Air”, published in the Journal of Environmental Economics and Management, Volume 5, (1978), and contains information on location, pricing, tax, and other information from the Boston housing market. I’ll be illustrating three things in this script:
- Downloading data directly from the web
- Parsing the data, removing extraneous information at the top of the file and writing the real data fields to a spreadsheet
- Adding a hyperlink for each record that links to a Google Map, based on the latitude and longitude data given
Note that it’s possible to do these steps using a web browser and an interactive Excel session. You can easily download the file, import it into Excel, remove the leading text, and make a formula to produce a hyperlink. But the beauty of this script is that everything is done automatically, which can be very handy if the source data is continuously updated.
Here’s the script that performs these operations, tested on both Python 2.7.11 and Python 3.7.3:
#
# xlwt_bostonhousing.py
#
import sys
from xlwt import Workbook, easyxf, Formula

def doxl():
    '''Read the boston_corrected.txt file based on
       Harrison, David, and Daniel L. Rubinfeld, "Hedonic Housing Prices
       and the Demand for Clean Air," Journal of Environmental Economics
       and Management, Volume 5, (1978), write to an excel spreadsheet .
       '''
    URL = 'http://lib.stat.cmu.edu/datasets/boston_corrected.txt'
    try:
        # For Python 3.0 and later
        from urllib.request import urlopen
    except ImportError:
        # Fall back to Python 2's urllib2
        from urllib2 import urlopen

    try:
        fp = urlopen(URL)
    except:
        print('Failed to download %s' % URL)
        sys.exit(1)
    lines = fp.readlines()

    wb = Workbook()
    ws = wb.add_sheet('Housing Data')
    ulstyle = easyxf('font: underline single')
    r = 0
    for line in lines:
        tokens = line.decode('cp1250').strip().split('\t')
        if len(tokens) != 21:
            continue
        for c,t in enumerate(tokens):
            for dtype in (int, float):
                try:
                    t = dtype(t)
                except:
                    pass
                else:
                    break
            ws.write(r, c+1, t)
        if r == 0:
            hdr = tokens
            ws.write(r, 0, 'MAPLINK')
        else:
            d = dict(zip(hdr, tokens))
            link = 'HYPERLINK("http://maps.google.com/maps?q=%s,+%s+(Observation+%s)&hl=en&ie=UTF8&z=14&iwloc=A";"MAP")' % (d['LAT'], d['LON'], d['OBS.'])
            ws.write(r, 0, Formula(link), ulstyle)

        r += 1
    wb.save('bostonhousing.xls')
    print ('Wrote bostonhousing.xls')

if __name__ == "__main__":
    doxl()
As in the previous post, you must have xlwt installed. See the Installation section of that post for instructions on installing xlwt. Let’s dive into the script.
URL = 'http://lib.stat.cmu.edu/datasets/boston_corrected.txt'
try:
    # For Python 3.0 and later
    from urllib.request import urlopen
except ImportError:
    # Fall back to Python 2's urllib2
    from urllib2 import urlopen

try:
    fp = urlopen(URL)
except:
    print ('Failed to download %s' % URL)
    sys.exit(1)
lines = fp.readlines()
These lines determine the library to use, urllib.request (Python3) or
urllib2 (Python2), for the urlopen module. Next, urlopen is used to
open the URL for the boston_corrected.txt file. The contents of the
file are read into lines as a list of strings. If
boston_corrected.txt cannot be read, a message is printed and the
script exits.
wb = Workbook()
ws = wb.add_sheet('Housing Data')
ulstyle = easyxf('font: underline single')
r = 0
This section creates a new Workbook object and adds a sheet named “Housing Data” to the workbook. The easyfx function provides a convenient way to add formatting to the spreadsheet. In this example, the single underline format is used to denote a hyperlink. In the next line, the variable r acts as a row counter.
The for loop below examines each row of data:
for line in lines:
    tokens = line.decode('cp1250').strip().split('\t')
    if len(tokens) != 21:
        continue
    for c, t in enumerate(tokens):
        for dtype in (int, float):
            try:
                t = dtype(t)
            except:
                pass
            else:
                break
        ws.write(r, c+1, t)
Each line is “stripped” (leading and trailing white space characters are removed), then split by tab characters. Since the boston_corrected.txt file contains some nonascii characters, you must provide the encoding method in Python 3. In this example, the encoding method (cp1250) is the standard Windows encoding method.
Next, the script checks the number of tab-separated fields. A data line must contain 21 fields of information, otherwise, it is rejected. To properly format the data for the spreadsheet, the datatype is set using try-except-else within the for loop. The loop only considers string, integer, and float data, which is sufficient for this input data. More complex input files might contain other data types and require additional handling. The cell data with the correct type setting is written to the spreadsheet using the ws.write statement.
The next section builds the hyperlink to a Google Map using the latitude and longitude information within the input data.
    if r == 0:
        hdr = tokens
        ws.write(r, 0, 'MAPLINK')
    else:
        d = dict(zip(hdr, tokens))
        link = 'HYPERLINK("http://maps.google.com/maps?q=%s,+%s+(Observation+%s)&hl=en&ie=UTF8&z=14&iwloc=A";"MAP")' % (d['LAT'], d['LON'], d['OBS.'])
        ws.write(r, 0, Formula(link), ulstyle)

    r += 1
wb.save('bostonhousing.xls')
print ('Wrote bostonhousing.xls')
If this is the first row of data (if r == 0), it is assumed to be
header data and is saved in the hdr variable. Otherwise, the statement
d = dict(zip(hdr,tokens)) builds a dictionary using the header
information as keys. This allows each field to be referenced by its
column heading. The hyperlink is built by specifying a URL containing
http://maps.google.com/maps?, with the corresponding latitude
d['LAT'] and longitude d['LON'] information from the current
line of data. Finally, the hyperlink data is written to the
spreadsheet with ws.write. The last two lines write the
spreadsheet and print a message.
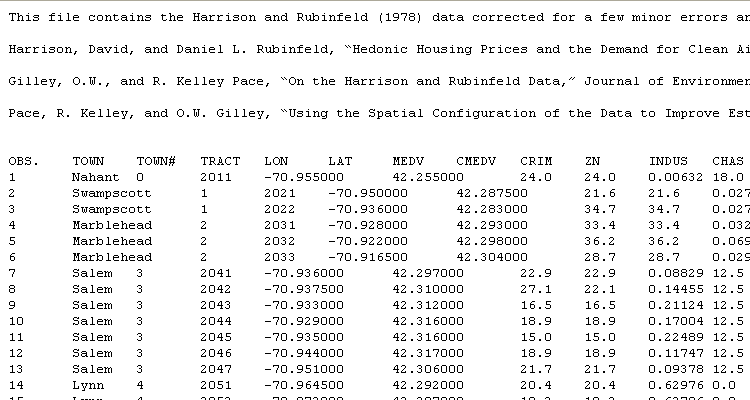
The original raw data looks like this:
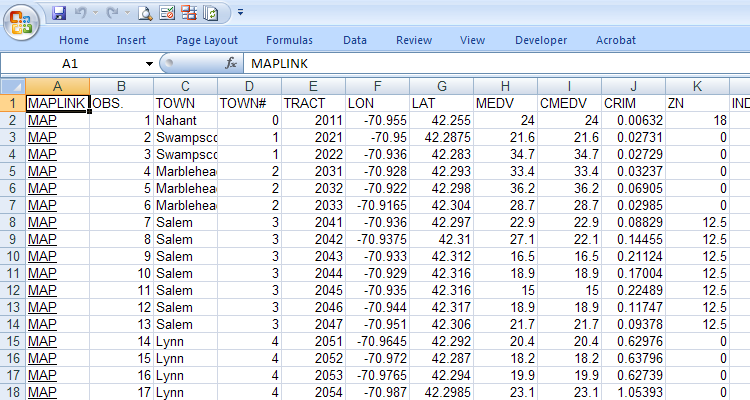
The bostonhousing.xls spreadsheet with the new map hyperlink written by this script looks like this:
Clicking the MAP link opens a Google Map showing the location based on the latitude and longitude.
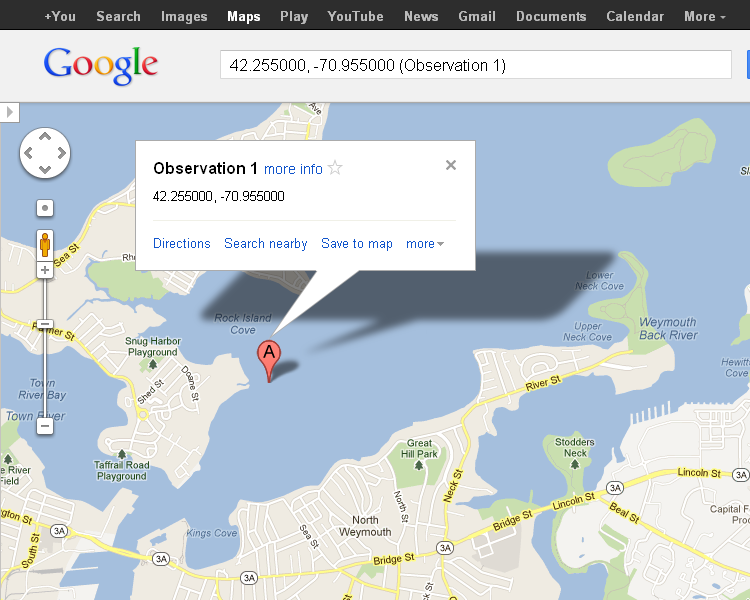
For some reason, the location of latitude 42.255000 and longitude -70.955000 isn’t in the town of Nahant, but in the middle of Rock Island Cove near Quincy. It’s left as an exercise for the reader to determine why this is so.
Prerequisites
Python (refer to http://www.python.org)
xlwt (refer to http://www.python-excel.org)
Source Files and Scripts
Source for the program and data text file are available at http://github.com/pythonexcels/xlwt
References
This site contains pointers to the best information available about working with Excel files in the Python programming language.
http://groups.google.com/group/python-excel
Google group for questions on xlrd, xlwt, xlutils and general questions on interfacing to Excel with Python
Originally posted on September 19, 2009 / Updated November 1, 2022